
Secretary of State Business Search for KYB: What It Proves
A Secretary of State search proves an entity exists and its status, not who owns it. What each state shows, good standing, agents, and BOI.


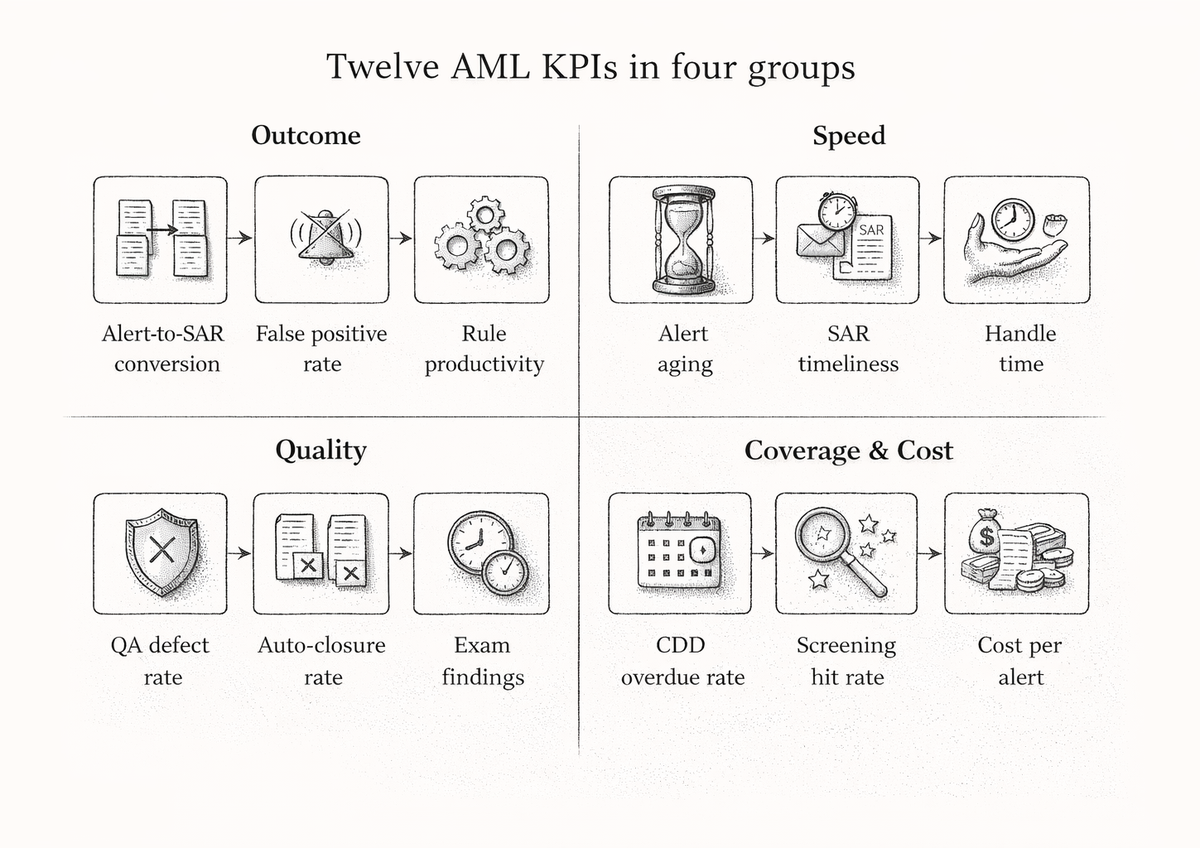
TL;DR: The AML compliance KPIs that matter measure whether alerts turn into useful reports, how fast decisions are made against the SAR clock, and whether closed work holds up under review. We track 12 of them across four groups: outcome, speed, quality, and coverage and cost. Volume alone says little: in a Bank Policy Institute study, large banks reviewed roughly 16 million alerts in 2017 and filed over 640,000 SARs, and a median of 4% of those SARs drew a follow-up inquiry from law enforcement.
A typical BSA dashboard reports alerts generated, alerts closed, SARs filed, and analyst headcount. Those numbers describe how busy the team was. They do not say whether the program found anything, whether it found it in time, or whether the closures would survive an examiner pulling a sample.
That gap is now a regulatory question as well as an operational one. In April 2026 FinCEN published a proposed rule to reform AML/CFT program requirements that, in FinCEN's words, aims to ensure institutions maintain effective programs that "lead to more effective outcomes." We covered the details in our explainer on FinCEN's effectiveness-based AML rule. The practical consequence for a BSA officer is simple: an examiner who is asked to judge effectiveness will want metrics that show it, and alert counts will not.
The Bank Policy Institute's Getting to Effectiveness study makes the point with numbers. Nineteen member banks employed over 14,000 people and spent approximately $2.4 billion on BSA/AML compliance, reviewed about 16 million alerts in 2017, and reported that a median of 4% of SARs warranted law enforcement follow-up. Effort was enormous. Measured outcome was thin. The broader case for measuring outcomes instead of throughput is one we have made before. This piece is the working list.
The 12 metrics below are grouped by the question each one answers. None of them works alone. A falling false positive rate with a rising QA defect rate is not progress.
Alert-to-SAR conversion is the share of alerts, or of escalated cases, that end in a SAR filing. Track it at two levels: alerts to cases, and cases to SARs. The first tells you how much of the alert stream deserves investigation. The second tells you whether escalation judgment is calibrated. Capgemini Invent's KYC and AML benchmark study of European banks found SARs as a share of transaction monitoring alerts to be "very heterogenous" across participants, which is why your own trend line matters more than an industry average. A sudden drop in conversion usually means a new rule is firing on noise. A sudden rise can mean a real typology is emerging, or that escalation standards loosened.
The false positive rate is the share of alerts closed with no suspicious finding. The same Capgemini study reported an average transaction monitoring false positive ratio of 92%. Report it per scenario and per customer segment, never only in aggregate, because one structuring rule at 99% can hide inside a portfolio average. Treat it as a cost signal, not a target. Driving it toward zero by raising thresholds just moves risk below the line.
Rule productivity is the number of SARs, or productive cases, each scenario produces per hundred alerts. It is the metric that tells you which rules to tune, retire, or keep. A rule that has fired 4,000 times in a year without a single escalation is consuming analyst hours for nothing, and a rule with high productivity but low volume may deserve a lower threshold. Productivity data feeds directly into transaction monitoring rule tuning, and any change should be tested with backtesting or shadow mode before it goes live.
Alert aging measures how long open alerts have been waiting, bucketed by age, for example under 10 days, 10 to 30, and over 30. Backlog is the count of alerts past your internal service level. The FFIEC BSA/AML Examination Manual says the 30-day SAR period does not begin when a system flags a transaction. It begins once an appropriate review determines the activity is suspicious, and that review "should be completed in a reasonable period of time." An aging alert queue is exactly what makes "reasonable" hard to defend. Report the oldest alert in the queue alongside the average, because averages hide the cases examiners find.
SAR filing timeliness is the share of SARs filed within the regulatory window. Under 31 CFR 1020.320, a bank files no later than 30 calendar days after initial detection, with one additional 30 days when no suspect was identified, and never later than day 60. Track three numbers: percent filed on time, median days from determination to filing, and the count of filings that used the 60-day extension. That last number deserves scrutiny. A team that leans on the extension when a suspect was in fact known is creating a late-filing finding.
Handle time is the analyst time spent per alert, measured by alert type. Pair it with outcome. A drop in handle time is good news only if conversion and QA results hold steady. A rise in handle time on one alert type often points to missing data, such as an analyst re-pulling the same customer profile from three systems for every alert. Handle time is also the input that makes capacity planning honest: alerts per month multiplied by minutes per alert tells you how many analysts the queue actually needs.
QA defect rate is the share of sampled closed alerts and cases where a reviewer found an error, split into critical defects (wrong disposition, missed SAR) and non-critical ones (incomplete documentation). This is the counterweight to every speed metric above. How to design the sample and score the work is covered in our guide to building an AML quality assurance program. For the dashboard, the point is to report the critical defect rate separately and by analyst, team, and alert type, so a problem is traced to its source.
Auto-closure rate is the share of alerts closed without an analyst decision, whether by rules-based suppression or by an AI agent. It is only a meaningful number when reported next to the QA defect rate on that same auto-closed population. An auto-closure rate of 60% with an unknown error rate is a liability. The same rate with a sampled critical defect rate below the human baseline is evidence. If an automated process is closing alerts, the sample has to cover it, and the reasoning behind each closure has to be readable by a reviewer.
Track the count of open findings from examinations, independent testing, and internal audit, their severity, and days to remediation. Repeat findings carry the most weight. A finding that reappears in the next exam cycle tells a board more about the program than any operational metric. For institutions heading into an exam, our BSA exam preparation guide covers what examiners typically request.
The CDD refresh overdue rate is the share of customers whose periodic or event-driven review is past due, broken out by risk rating. Overdue high-risk reviews are the number to watch, because a stale profile undermines everything downstream: monitoring compares activity against an expected profile that may be years old. The refresh schedule itself should follow your customer risk rating methodology, and institutions moving toward perpetual KYC should also track how many refreshes were triggered by events rather than calendar dates.
Screening hit rate is the share of screened names, customers or payments, that generate a potential match, alongside the true match rate. The gap between the two is the screening team's workload. BPI's study found that sanctions screening at participating banks produced true matches at an overall median of 0.00004%. A high hit rate with a near-zero true match rate usually points to name-matching configuration, not risk, which is the subject of our piece on sanctions screening name matching.
Cost per alert is total alert review cost, including people, tooling, and outsourcing, divided by alerts reviewed. Cost per SAR is the more honest companion, since it charges the whole review effort to the reports that came out of it. These two numbers turn the metrics above into a budget conversation. A program that halves cost per alert but doubles the false positive rate has not become cheaper. It has moved the cost into the queue.
We built Sphinx's agents to review alerts the way analysts do, and that changes which of these metrics move and which ones need more attention. Handle time and alert aging fall first. Across our deployments we see 98% of cases resolved same-day and six-month backlogs cleared in days. Those are speed metrics, and on their own they prove nothing about quality.
That is why we treat metrics 7 and 8 as the real test. When an agent closes an alert, the QA sample has to include that closure, and the reviewer has to be able to read the reasoning, the data the agent checked, and why it decided what it decided. If a team cannot answer "what is the critical defect rate on agent-closed alerts," it has not measured automation. It has assumed it.
Some metrics automation does not touch. Rule productivity still depends on scenario design. CDD overdue rates depend on whether customers respond to outreach. Exam findings depend on governance. A program that automates review without fixing those will report faster numbers on the same underlying gaps.
The useful dashboard is short. Twelve metrics, each read next to its counterweight, reported by segment and trended over time. That is the evidence an effectiveness standard asks for, and most of it already sits in your case management system waiting to be counted.
No regulator publishes a benchmark, and peer rates vary widely: Capgemini Invent's benchmark study described SARs as a share of transaction monitoring alerts as very heterogeneous across banks. The more useful measure is your own rate trended by scenario and segment, with explanations for sharp moves in either direction.
Under 31 CFR 1020.320 and the FFIEC BSA/AML Examination Manual, the clock starts at initial detection, which means the point at which a review determines the activity is suspicious, not the moment a system generates an alert. The review itself still has to be completed in a reasonable period of time, which is why alert aging matters.
Boards need a small set of trended metrics with context: SAR filing timeliness, alert backlog and oldest open alert, critical QA defect rate, overdue high-risk CDD reviews, and open exam findings. Each should come with a short explanation of what changed and what the team is doing about it.
Not by itself. A false positive rate can fall because thresholds were raised and real activity now sits below the line. Read it next to alert-to-SAR conversion, rule productivity, and QA results, and validate threshold changes with below-the-line testing.
Report the auto-closure rate alongside a QA defect rate calculated on a sample of the auto-closed population, and compare it with the human baseline. The automated decision should leave a documented rationale a reviewer can check, or the sample cannot be scored.
A Secretary of State search proves an entity exists and its status, not who owns it. What each state shows, good standing, agents, and BOI.
A 12-step AML checklist for switching compliance platforms: exit terms, 5-year BSA record retention, validation, parallel runs, and cutover.

25 questions to ask AML software vendors in an RFP, grouped by detection, explainability, model risk, data, security, pricing, and proof.

How to verify foreign businesses: registry access by jurisdiction, non-Latin names, UBO thresholds, apostilles, FATF lists, and a coverage test.

A risk-based approach to AML identifies, assesses, and mitigates illicit finance risk in proportion to that risk. It is not the written assessment.

A bank files a SAR within 30 days of initial detection, or 60 days if no suspect was identified that day.
Payment screening compares a wire, ACH, or SWIFT message with sanctions lists before funds move. It is separate from customer name screening.
Source of funds traces a transfer. Source of wealth traces how net worth was built. When each is required, and what evidence holds.
Automate CIP, screening, UBO resolution, risk rating, and the evidence pack. Source of wealth, high-risk approval, and SAR suspicion stay with a person.
Best compliance software for credit unions has to cover BSA/AML, sanctions, KYC, shared branching, and examiner-ready case files.
What a bank sanctions screening program must include: lists, customer and payment screening, escalation, and examiner records.

How to cut false alerts in transaction monitoring by tuning one scenario at a time, fixing data, and keeping the threshold version.
How to compare UBO mapping tools when a U.S. registry does not return owners: chains, the 25 percent prong, and the control person.
How to set lists, match thresholds, disposition paths, and testing for automated sanctions screening alerts.
What a KYB API returns from a U.S. registry, what it does not, and why banks still collect beneficial owners under CDD.

How compliance teams build, tune, and document transaction monitoring: risk-based scenarios, data quality, and alert decisions.
What to evaluate in AI screening alert tools: triage, false-positive claims, OFAC calibration, and an audit trail you can replay.
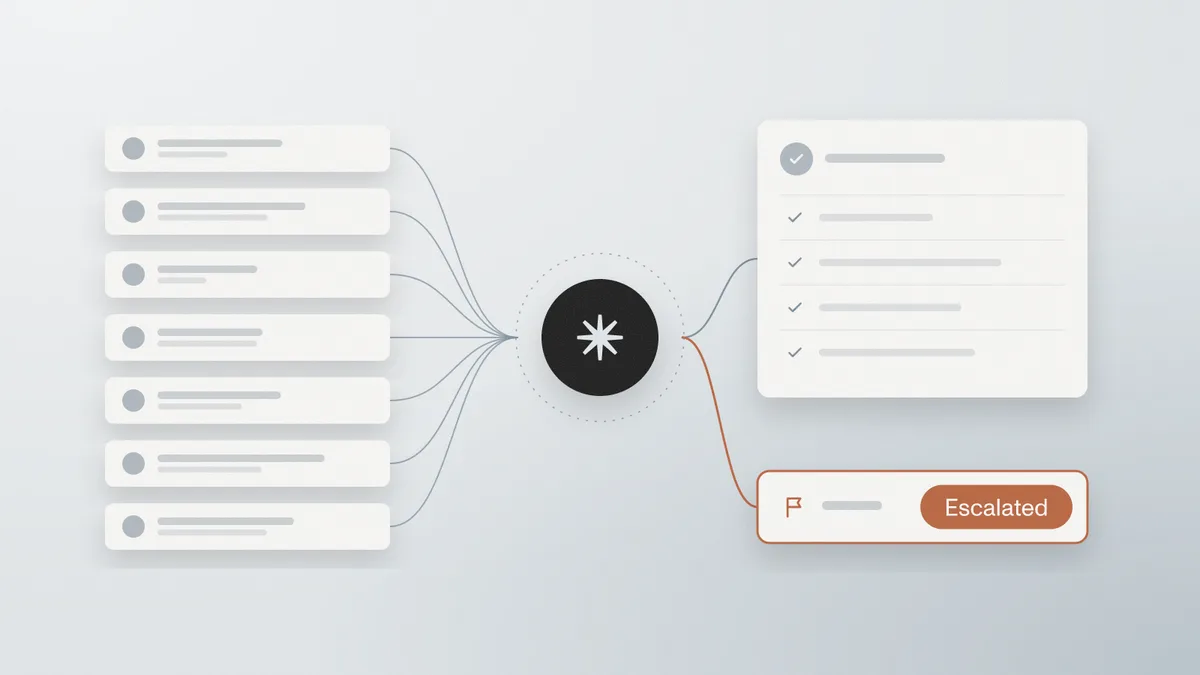
What breaks a compliance platform at high alert volume: queue age, rule noise, analyst minutes, and audit reconstruction.
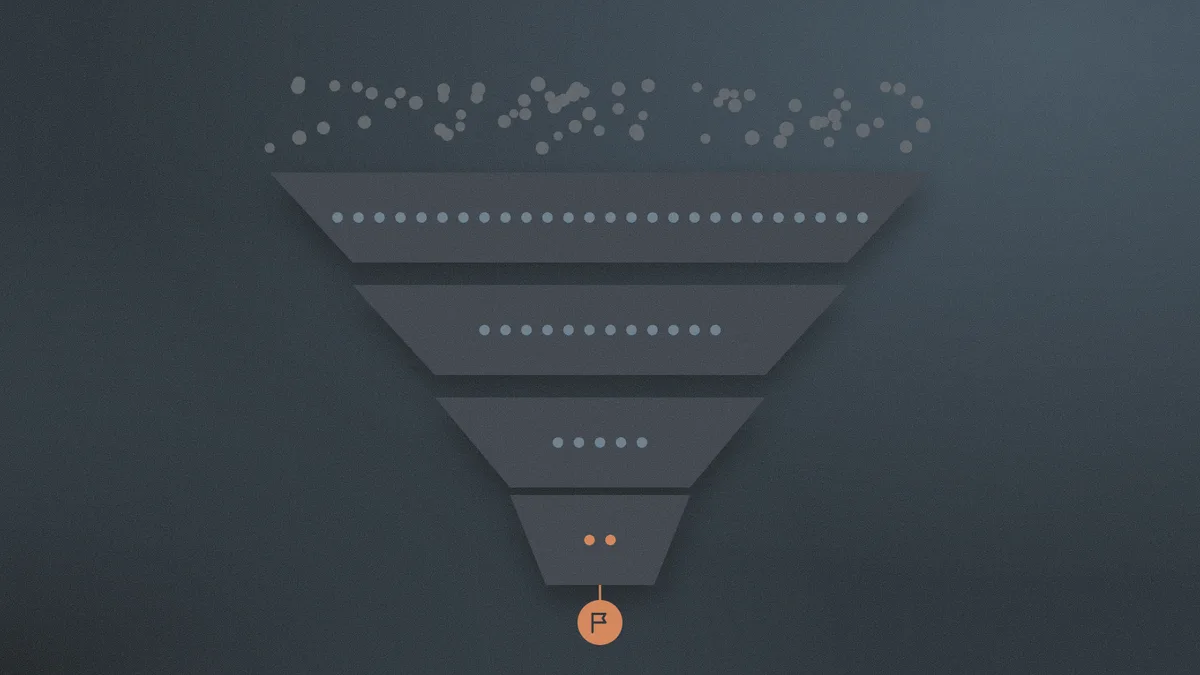
Manual KYB cost covers analyst time, rework, lost onboardings, missed owners, and later audit reconstruction. Corporate reviews average $2,274.

Small fintechs need a full KYB file: entity, owners, control person, refresh, and an audit trail. Cheap checks skip the hard parts.
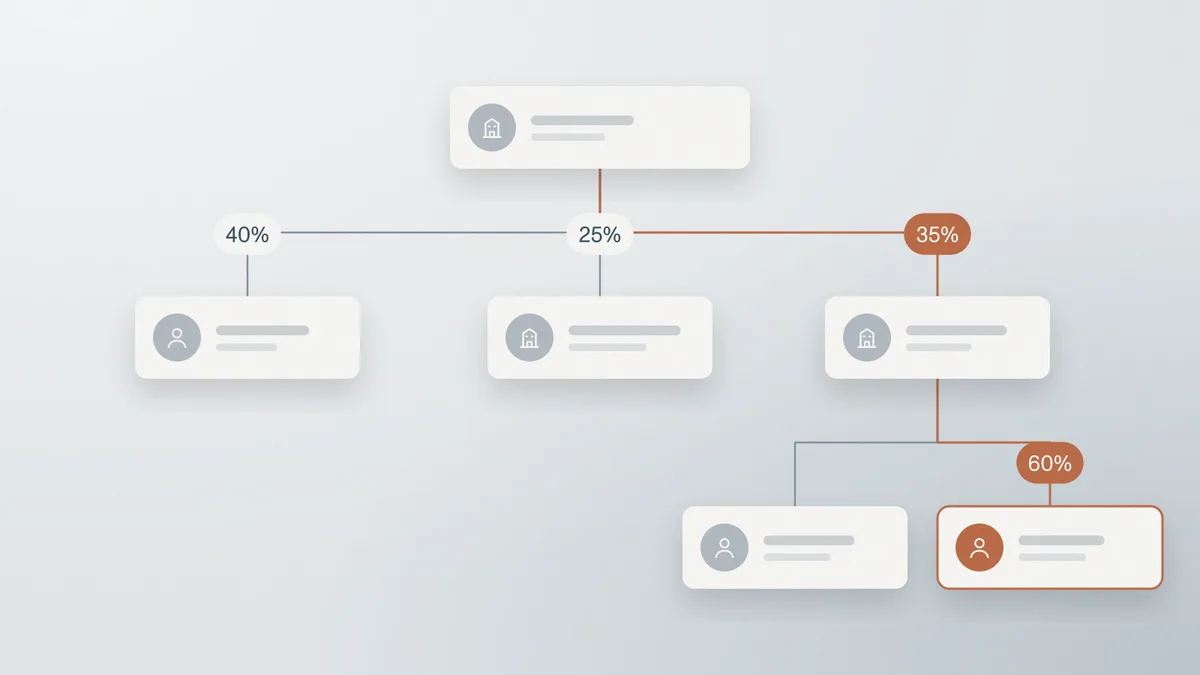
AML screening is slow because each hit is research: list updates, fuzzy names, weak aliases, missing context, and a written disposition.

What payment processors and payfacs should demand from KYB: sub-merchant underwriting, ownership, and monitoring after the business changes.
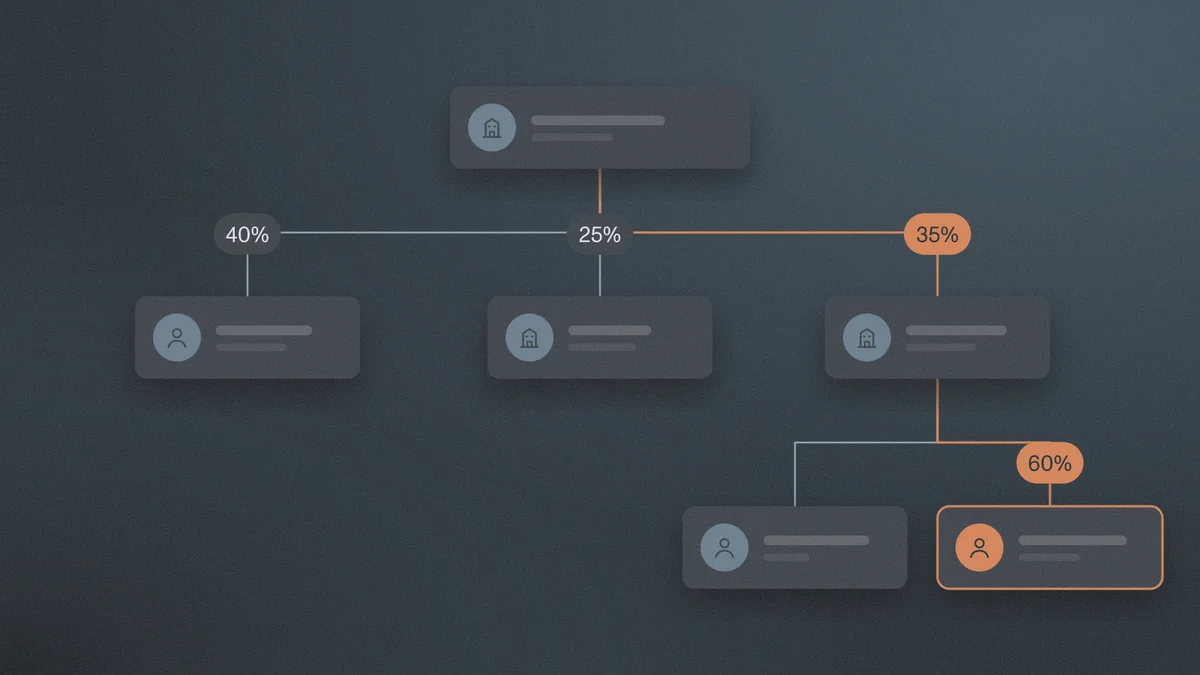
KYC false positives start in the name match. FCA tests found 75% detection on slight variants. How list scope and date of birth clear the rest.
What a BSA program must operate: CIP, CDD, SAR and CTR filings, sanctions screening, and risk-based controls.

How to backtest AML rules on historical data, run shadow mode and champion-challenger in production, and document results for model risk management.

How entity resolution and graph analytics identify beneficial owners: probabilistic matching, blocking, indirect ownership math, cycles, registry limits.

Integration patterns, data mapping, cutoffs, sandbox and UAT, reconciliation, and post-go-live failures when connecting AML and KYC tools to a bank core.

Compliance orchestration routes data, decisions, and cases across KYC, KYB, sanctions, and monitoring tools. Architecture patterns and what to evaluate.

Senate PSI report: 84% of Iran-linked sanctioned wallets ran on USDT. Why a post-designation freeze is not a sanctions program, and what regulators ask.

Brazil's betting ban pushes 30M bettors to illegal sites. What Pix monitoring teams will see, SPA Ordinance 2,750's red flags, and why alert queues flood.
MP 1,394 article by article: CPF refund lists, the 7-day bank restitution window, SPA reporting, Caixa fallback, and the pending Central Bank Pix block.
Who counts as an MSB, FinCEN Form 107 registration, state licensing, the $2,000 SAR threshold, agent oversight, and what IRS BSA examiners find.

The OFAC SDN List names blocked persons, vessels, aircraft, and crypto addresses. How screening works, what a true hit requires, and what a miss costs.

What the crypto Travel Rule requires of VASPs: FATF R.16, FinCEN's $3,000 rule, EU and UK thresholds, self-hosted wallets, IVMS 101, and the sunrise gap.

How bust-out fraud works, how it differs from default and account takeover, the signals and features that catch it, and why the loss ends up as a SAR.
How to run an enterprise BSA/AML risk assessment: FFIEC categories, inherent vs. residual risk, refresh triggers, examiner criticisms, program linkage.
How fuzzy name matching works in sanctions screening: Levenshtein, Jaro-Winkler, phonetic keys, OFAC's own scorer, threshold trade-offs, and validation.
Placement, layering, and integration: the techniques, transaction-data signatures, and controls at each stage, and why real schemes break the model.
CIP is the BSA identity program at account opening under 31 CFR 1020.220.

A Currency Transaction Report is FinCEN Form 112 for cash over $10,000 in one business day. Covers aggregation, exemptions, and how CTRs differ from SARs.
What FinCEN 314(a) information sharing is: government-to-institution searches, 14-day match reporting, and how it differs from voluntary 314(b).
BSA officer responsibilities go beyond a board title: designation, independence, SAR authority, board reporting, staffing, and what examiners test.

Wire fraud detection for banks: known-number callbacks, beneficiary checks, mule holds, and 24-hour IC3 recall. IC3 reported $20.877B in 2025 losses.
BSA independent testing: independence, risk-based frequency, sampling, board reporting, and what OCC examiners expect after Bulletin 2025-37.

How banks evaluate AML vendors under OCC and FFIEC third-party risk rules, including residual BSA risk for processors, screening, BPO, and model vendors.
How banks and credit unions detect altered, counterfeit, forged, and duplicate checks: typologies, detection layers, Reg CC holds, and SAR key terms.
What an AML lookback review is, what triggers one, how regulators scope it, what TD Bank-scale lookbacks cost, and how automation changes the economics.

Shell company red flags at onboarding and in transaction activity, how to investigate a suspected shell, and what detection tooling needs to do.
The five pillars of an AML compliance program, what examiners test under each, common exam findings, and how FinCEN's 2026 proposed rule reframes them.

How transaction monitoring rule tuning works: ATL/BTL testing, sensitivity analysis, segmentation, cadence, and the documentation examiners expect.
How banks detect account takeover fraud: attack vectors, the signals that give ATO away, SAR and FFIEC obligations, and how to evaluate detection tools.
Customer risk rating in AML: the five factors behind the score, static vs dynamic rating, how scores drive EDD and monitoring, and what examiners expect.
FinCEN human trafficking red flags for banks: labor vs sex trafficking footprints, funnel accounts, payroll absences, SAR filing rules, and forced criminality typologies.
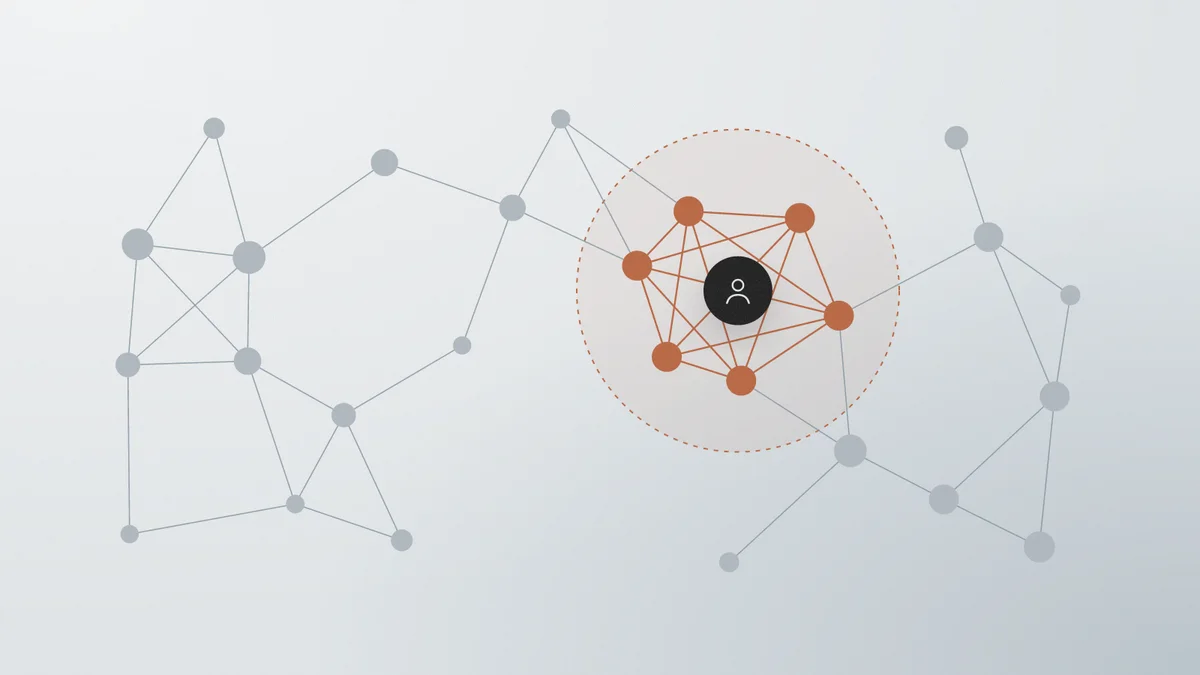
How FinCEN 314(b) information sharing works after the June 2026 fact sheet: safe harbor conditions, fraud coverage, real-time sharing, enrollment, and the renewal trap.

APP fraud prevention across UK, EU and US rules: what Confirmation of Payee fixes, what it cannot, and why receiving-side mule detection only got built when liability shifted.
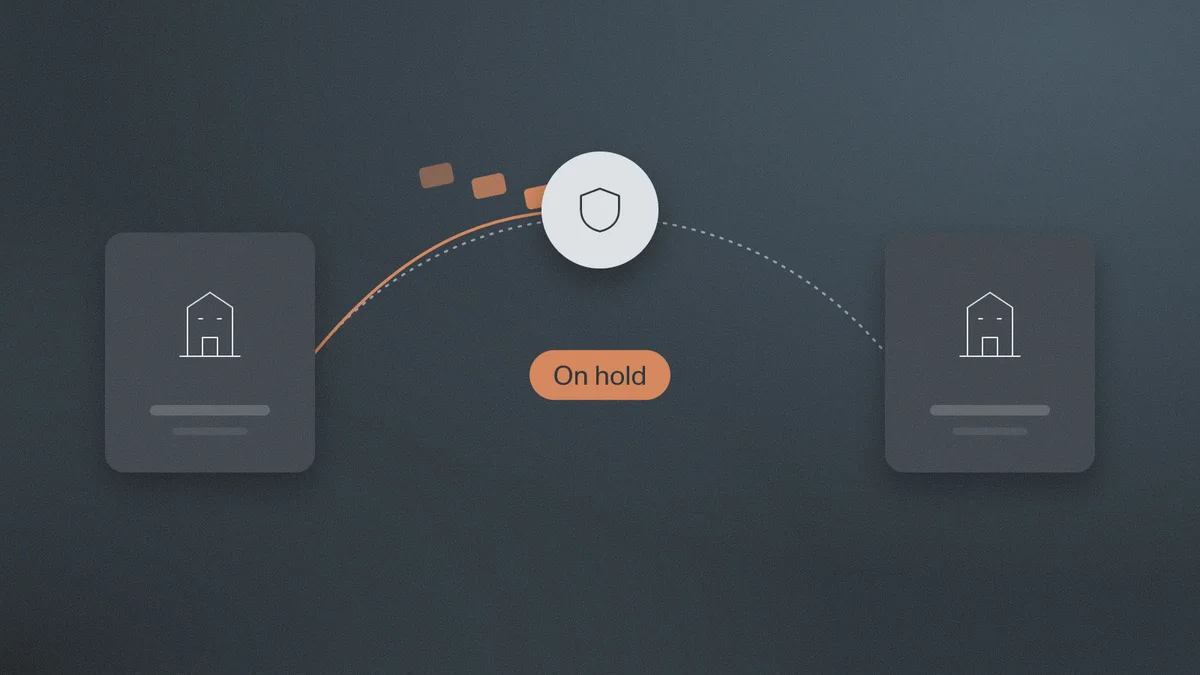
What the GENIUS Act requires of stablecoin issuers: reserves, BSA program, seize and freeze capability, Travel Rule, MiCA comparison, and the secondary market gap.
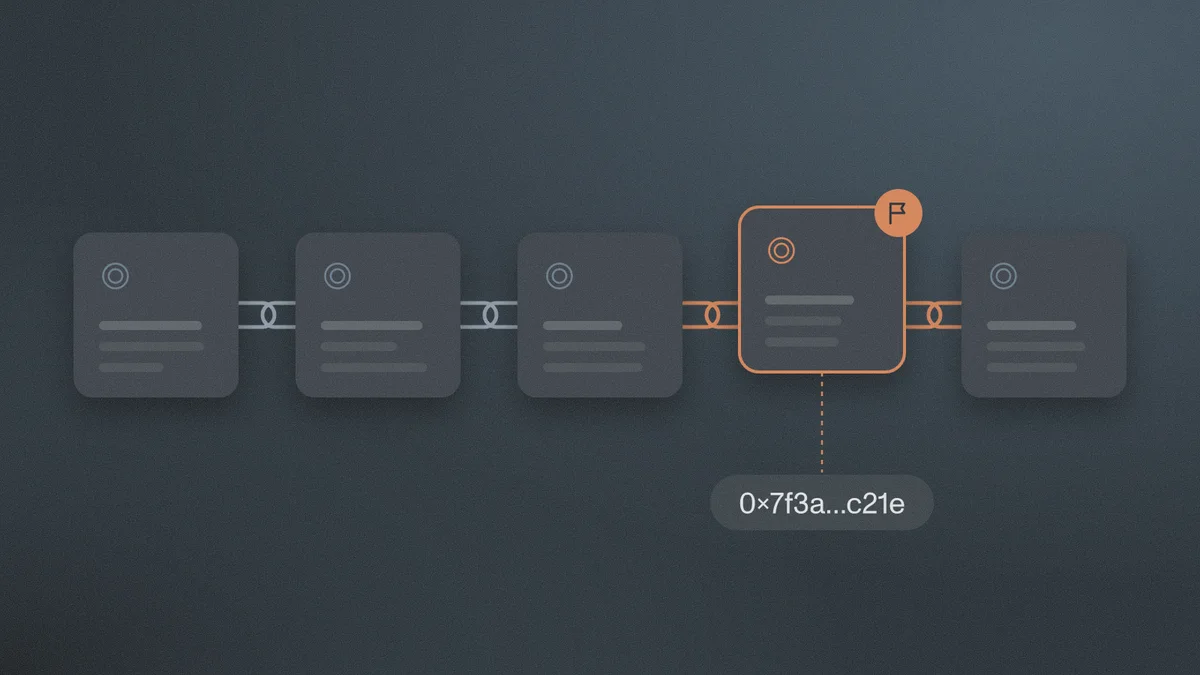
Why synthetic identities pass CIP, how the credit bust-out lifecycle works, which signals actually detect them, and why the risk concentrates in super prime.
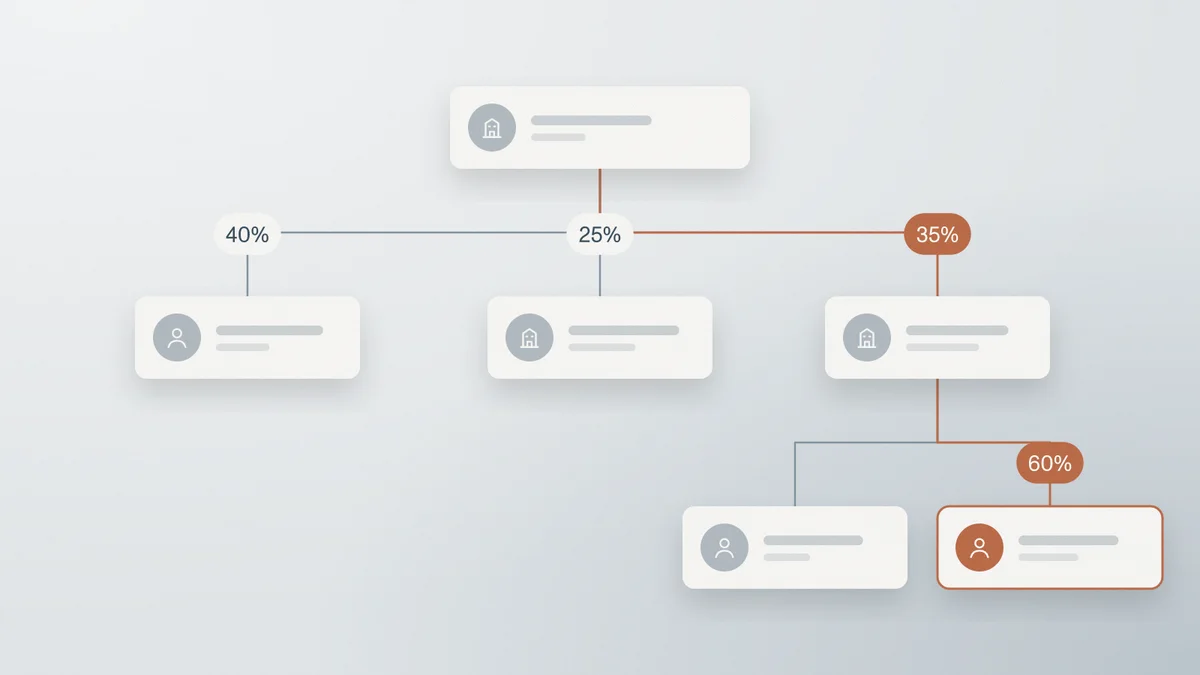
How to build an AML QA program: sampling design, scorecards, error taxonomy, 2026 enforcement actions, and what changes when AI agents disposition alerts.

How banks detect pig butchering scams: FinCEN red flags, the trial-transaction signal, receiving-side mule controls, and why 78% of victims defend the payment.
Eight financial crime, compliance and fintech conferences in fall 2026. Dates, cost, audience, date conflicts and which deserves your travel budget.

ACAMS Assembly Las Vegas 2026 runs Sept 29-Oct 1 at ARIA. Theme, agenda, 15 credits, the free CAMS seminar most attendees miss, and how to prepare.
XLoD Global New York 2026 runs Sept 24 at the Javits Center. Streams, speakers, who attends, how to prepare and what to ask vendors.

Money20/20 USA 2026 runs Oct 18-21 at The Venetian, Las Vegas. Content pillars, costs, schedule, who it suits and how to prepare.
FinovateFall 2026 runs Sept 9-11 at the Marriott Marquis Times Square, NYC. Demo format, agenda, compliance sessions, costs and how to prepare.

Global Anti-Scam Summit America 2026 runs Sept 2-3 at Pier 48, San Francisco. Dates, ticket tiers, agenda focus areas, who attends and how to prepare.

Stablecon 2026 runs Sept 9-11 at National Harbor, Maryland. Dates, venue, agenda, GENIUS Act context, who attends and how to prepare.
Elder financial exploitation detection separates elder scams from theft by trusted persons. FinCEN SAR rules, red flags, and how to evaluate a program.
Sanctions evasion red flags across six typologies: front companies, ownership obfuscation, transshipment, AIS manipulation, and trade misdescription.

Structuring in banking explained: 31 U.S.C. 5324, the $10,000 CTR threshold, red flags, SAR obligations, and how to build defensible detection.
How sponsor banks supervise fintech and BaaS partners: third-party risk expectations, who owns BSA/AML, ledger access, and oversight cadence.

How correspondent banks assess respondent institutions: FATF Rec 13, the Wolfsberg CBDDQ, nested accounts and Section 312 enhanced due diligence.

Trade-based money laundering moves criminal value through misinvoiced trade. The core techniques, red flags in trade finance, and how to build controls.
What AML model validation requires after SR 26-2 replaced SR 11-7: scope, threshold tuning, outcomes analysis, and the evidence examiners expect.
Compare API-first compliance platforms that embed screening, monitoring, and verification into product workflows. Covers latency, pricing, and integration patterns.
Compare business onboarding software for banks, credit unions, and fintechs. Covers KYB verification, UBO mapping, screening, and risk-based due diligence workflows.
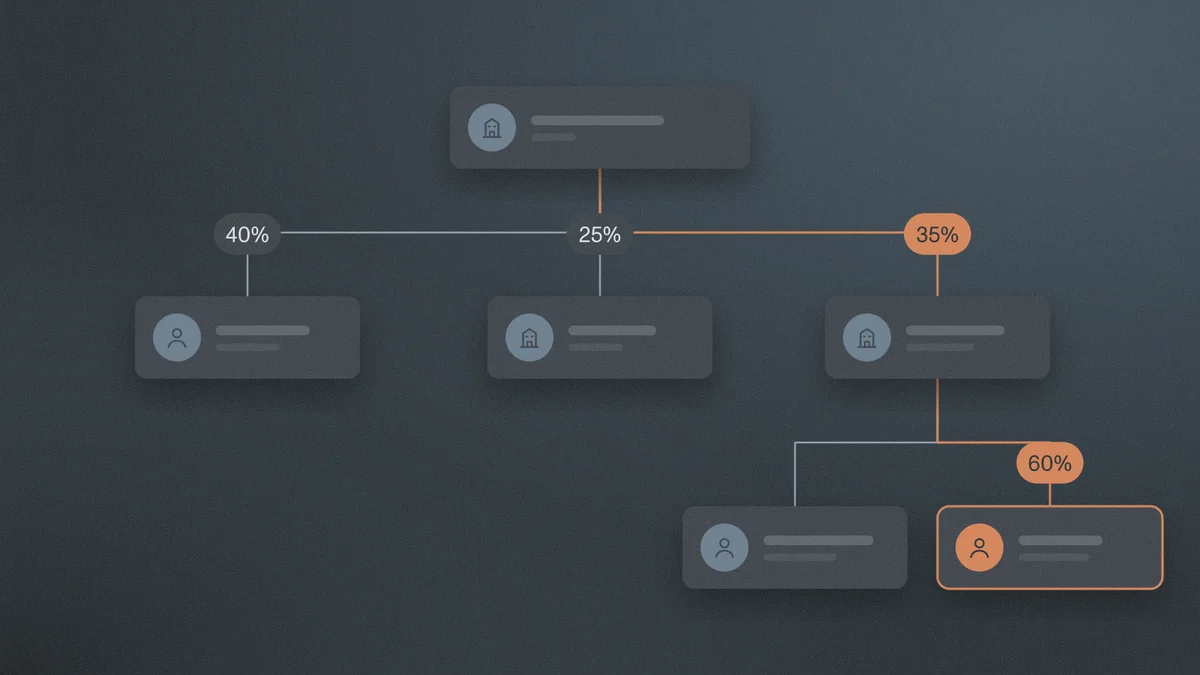
Head-to-head comparison of transaction monitoring software pricing models, key features, and ROI drivers for banks and fintechs in 2026.

How banks detect fraud in real time using rules, behavioral analytics, and network intelligence. Covers detection architecture, false positive management, and regulatory expectations.

Compare compliance automation platforms for fintechs: financial crime compliance (AML, KYC) and security compliance (SOC 2, ISO 27001). Evaluation criteria and pricing.
Compare the best financial crime prevention software for banks and fintechs in 2026. Covers unified platforms, AI-native challengers, and key evaluation criteria.

Compare KYB platforms for regulated financial institutions including LexisNexis, Middesk, Alloy, Trulioo, GBG, and Sumsub with audit trail and compliance evaluation criteria.

A practical guide to automating AML and KYC compliance processes covering alert triage, screening, onboarding, and SAR filing with evaluation criteria and common pitfalls.

Compare the top KYB automation platforms for fintech in 2026. Covers Middesk, Sumsub, Alloy, Persona, Trulioo, and more with pricing, coverage, and evaluation criteria.
Five practical strategies to cut business verification time including parallel checks, API-first data, automated UBO traversal, risk-based routing, and perpetual monitoring.

How the OFAC 50 Percent Rule works, including indirect ownership, aggregation across sanctioned owners, and documenting screening decisions.

A mule account moves fraud proceeds through the banking system. Learn the detection signals, analyst investigation steps, and SAR reporting requirements.
Credit unions face document fraud at three unique entry points: member onboarding, indirect lending, and shared branching. How to evaluate detection at credit union scale.
AI-generated document fraud is surging. Most onboarding platforms rely on OCR and template matching that miss synthetic forgeries. How multi-layer verification catches what legacy checks cannot.

A guide to the four types of document fraud in banking and the five-layer detection framework compliance teams need to catch AI-generated fakes.
Community banks face the same BSA/AML requirements as institutions 10x their size. Learn what to look for in AML technology, how FinCEN's effectiveness rule changes the game, and how to evaluate solutions for $1B-$10B institutions.

What BSA examiners evaluate at community banks in 2026: risk assessment currency, TM tuning rationale, SAR narrative quality, CDD documentation, and how AI audit trails change the exam conversation.

Ranked comparison of the top crypto compliance software in 2026 covering Chainalysis, TRM Labs, Elliptic, ComplyAdvantage, Crystal Intelligence, Merkle Science, Notabene, and Sphinx.

UBO mapping automation replaces manual ownership tracing with systems that reconstruct corporate ownership graphs programmatically. Learn how to evaluate tools.
Ranked comparison of the best SAR filing software in 2026 covering Hummingbird, Abrigo, NICE Actimize, Verafin, Lucinity, Unit21, Flagright, and Sphinx.
Ranked comparison of the best transaction monitoring software in 2026 covering NICE Actimize, SAS, Feedzai, Hawk AI, ComplyAdvantage, Verafin, Unit21, Quantexa, and Sphinx.
Ranked comparison of the best sanctions screening software in 2026 covering Dow Jones, Refinitiv, ComplyAdvantage, NICE Actimize, LexisNexis, Napier AI, Alessa, and Sphinx.
PEP screening identifies politically exposed persons, their family members, and close associates to apply risk-based enhanced due diligence under FATF and AML regulations.

Adverse media screening searches public sources for risk signals about customers. Learn what regulators require and how to evaluate a screening program.
Ranked guide to the best compliance case management software in 2026. Covers evaluation criteria, platform categories, regulatory requirements, and how to choose.

Financial crime detection identifies suspicious activity after the fact. Prevention stops it before funds move. Here is how to evaluate the right balance for your compliance program.

Evaluate business onboarding automation software for banks. Covers KYB verification, beneficial ownership, sanctions screening, and what to look for in a platform.
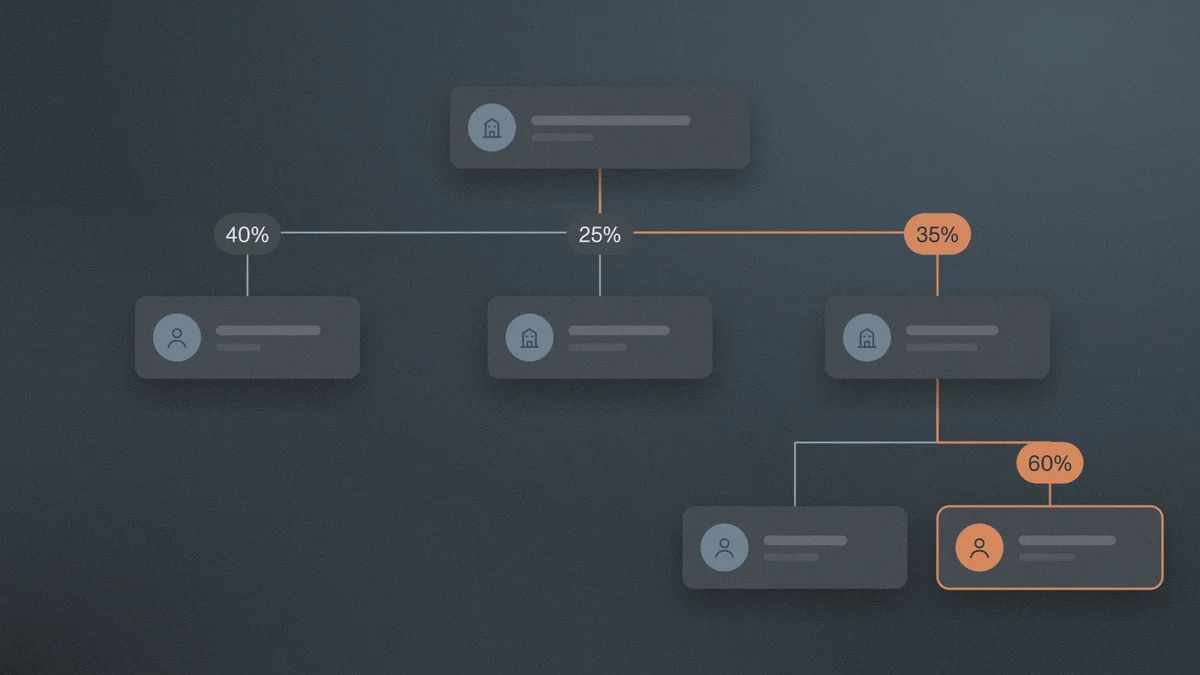
What banks must verify, monitor, and document under FinCEN's CDD Rule — including the 2026 beneficial ownership changes and how to evaluate your program.
Compare risk assessment software for banks and fintechs. Covers AML risk scoring, regulatory alignment, audit trails, and what compliance teams should evaluate.
Modern fraud detection layers ML scoring, behavioral biometrics, and graph neural networks to catch fraud in milliseconds while reducing false positives.
Perpetual KYC (pKYC) replaces periodic reviews with continuous, event-driven monitoring. Learn how it works, what triggers reviews, and what it takes to implement.

Compliance officer burnout is a systems problem, not a people problem. Learn how AI case-level automation removes repetitive volume and makes the role sustainable.

The AML efficiency gap separates compliance activity from risk reduction. Learn how outcome-based measurement and lower false positive rates close it.

Learn how to write SAR narratives that law enforcement can act on. Covers FinCEN's five-W framework, October 2025 guidance changes, and common mistakes to avoid.
FRAML merges fraud and AML into one program. Learn why 93% of mid-market banks are converging, the cost savings, and how to evaluate readiness.
FinCEN's 2026 proposed rule replaces process-driven AML compliance with an effectiveness-based standard. Learn the two-pronged framework and how to prepare.
Ranked comparison of the best fraud detection platforms in 2026 covering Feedzai, NICE Actimize, Featurespace, SAS, and Hawk AI with an evaluation framework.

Ranked guide to the best compliance software for financial services in 2026, covering AML, KYC, KYB, and security compliance platforms.
UBO identification traces beneficial ownership through corporate layers to find the natural persons who own or control an entity.
Ranked comparison of the best AML software in 2026 covering ComplyAdvantage, NICE Actimize, LexisNexis, Hawk AI, TRM Labs, Alloy, and Sphinx.
Screening alerts take 30-45 minutes each, with 85-90% being false positives. Four capabilities cut review time without compromising audit readiness.

Enhanced Due Diligence (EDD) applies deeper scrutiny to high-risk customers. Covers triggers, requirements, source of funds verification, and the operational cost of EDD programs.
KYB (Know Your Business) verifies business entities, ownership structures, and beneficial owners. Guide covering FinCEN CDD Rule, FATF Rec 24, and evaluation criteria.
KYC verifies individuals, KYB verifies business entities and their beneficial owners. A comparison of scope, complexity, cost, and regulatory drivers.
Screening alert backlogs are a design problem, not a staffing problem. Most systems were built to flag matches, never to resolve them at scale.
AML transaction monitoring detects suspicious financial activity through rules and behavioral models. Covers detection methods, alert investigation, SAR filing, and false positives.

U.S. crypto AML compliance: regulators are no longer satisfied with policy documents. They want evidence that the program actually ran.

Compare the best KYC software in 2026. See top vendors, key strengths, and the compliance gaps buyers should evaluate before choosing.

Learn what actually reduces AML false positives - data quality, context, explainability, and automation - and how to spot vendor theater.

Global compliance automation that scales seamlessly across borders.

Try another keyword or explore a different topic.